Computer Science: How to lie With statistics
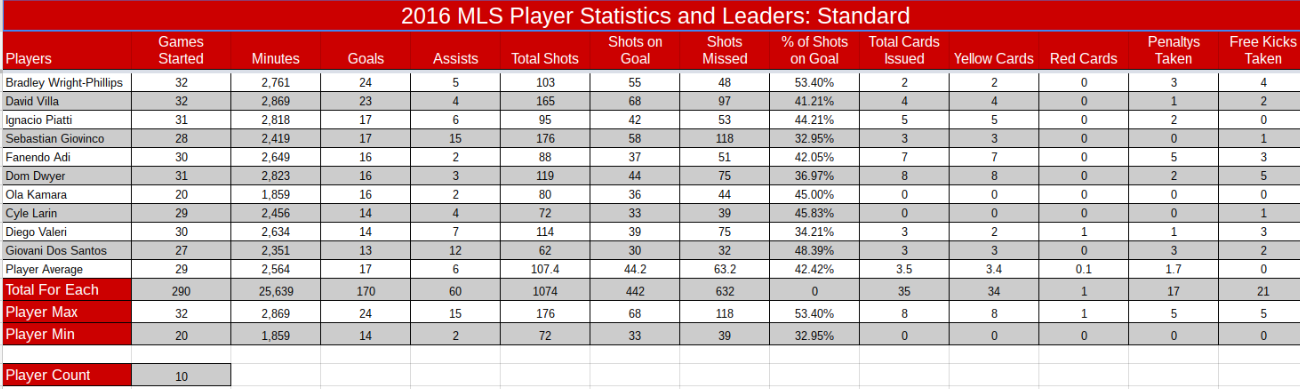
For the TedTalk Project for Computer Science I completed both a Sheets deliverable and searched for data and stats for my TedTalk. First, for the sheets, I did my topic on MLS soccer players. I used many simple functions like +, -, *, and /. Aside from those, I used count, sum, and multi-step equations. I received a 4 on this project. I did all the steps beside * and /. I didn't resubmit.
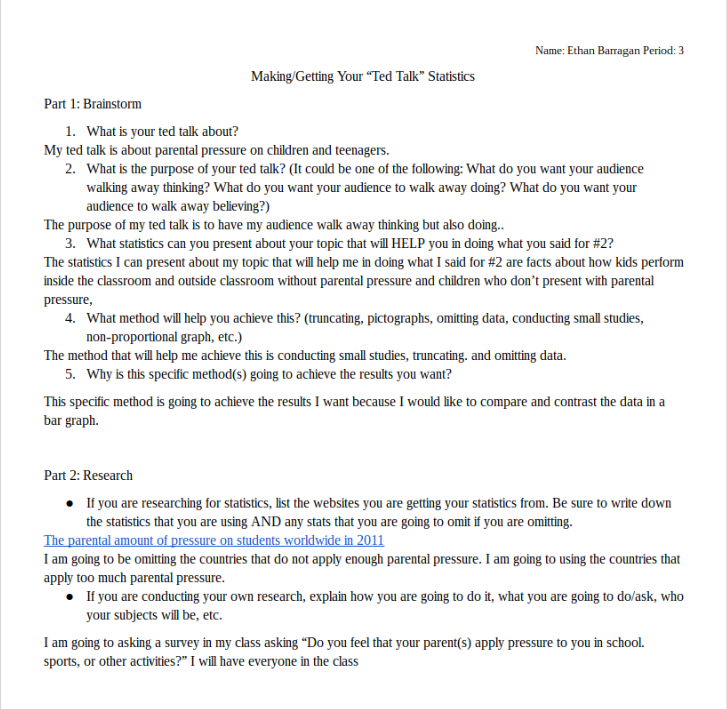
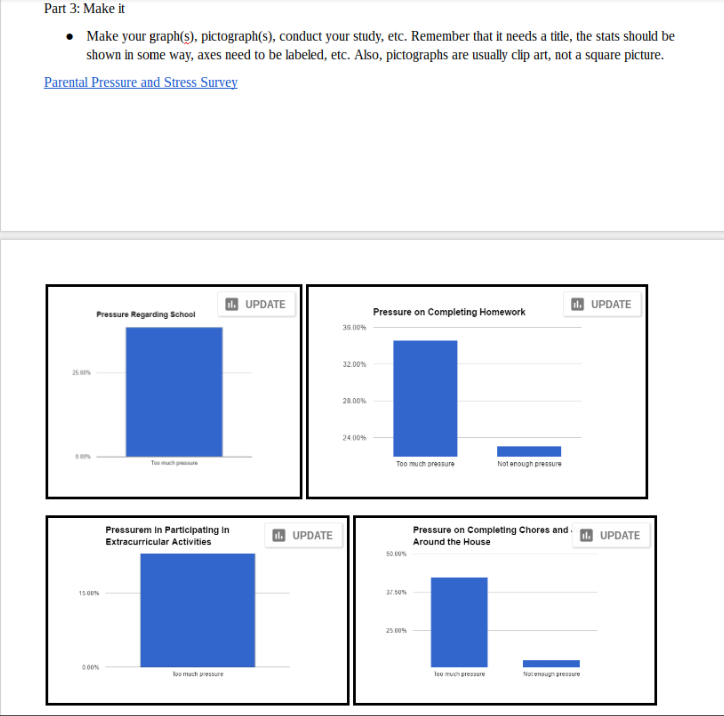
Secondly, for the HTLWS, I created a survey, I surveyed everyone in my class. It was a five question survey. With the stats and data I collected, I turned the survey into multiple bar graphs. I created original and changed graphs. The original graphs had no changes. But the changed graphs had two ways to persuade the general audience. I used omitting and truncating on the graphs. Omitting means to leave out or not put in. And truncating means to cut or make shorter. Those are the two ways to persuade I used. I received a 4 on this assignment.
Secondly, for the HTLWS, I created a survey, I surveyed everyone in my class. It was a five question survey. With the stats and data I collected, I turned the survey into multiple bar graphs. I created original and changed graphs. The original graphs had no changes. But the changed graphs had two ways to persuade the general audience. I used omitting and truncating on the graphs. Omitting means to leave out or not put in. And truncating means to cut or make shorter. Those are the two ways to persuade I used. I received a 4 on this assignment.
|
|
